 rochePlot home page

 RochePlot is a Fortran code using PGPlot
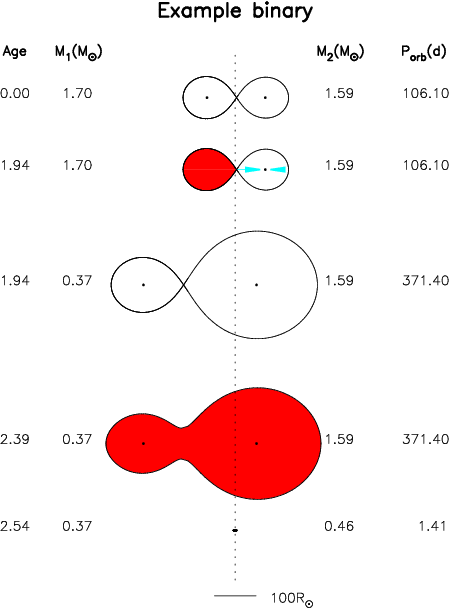
to plot a series of binaries to illustrate the key stages in the evolution of a binary star.
The code was originally written by Frank Verbunt
and further developed by Marc van der Sluys.
The code has been used with gfortran (4.8 or newer),
g95 and
Intel Fortran
and can be used under the conditions of version 3 of the GPL.
The default installer uses CMake. Plotting is done by
PGPlot. RochePlot uses some routines from the Fortran
library libSUFR.
Running rochePlot
 In order to run rochePlot, you must provide the data of the binary stars you want to plot in an input file.
The program expects the name of the input file as a command-line argument. If no argument is given, the code tries to find the example
input file rochePlot.dat in a number of likely locations on
your system. The example input file is included in the share/ directory of the package tarball, and should be installed in
/usr/share/rochePlot/ on a typical Linux system. The image to the right is produced using the default rochePlot.dat.
Input file
In the input file, the user specifies the number of labels that need to be printed, and the desired number of binaries (or evolutionary
stages). The masses of the stars and the orbital period are printed by default, a fourth column can be used if desired, as in the case
of the age in the example to the right. For each binary, the stellar masses (in M⊙) and radii (in
R⊙), and the orbital period (in days) must be provided. If a radius exceeds 105 R⊙,
the star is assumed to fill its Roche lobe. If a star fills its Roche lobe, an accretion disc will be drawn around the accretor. To
prevent this, place a negative sign in front of the accretor's radius. If both stars fill their Roche lobes, an impression of the
onset of a common envelope is drawn (any resemblance to a peanut is accidental).
Further parameters in the input file are used to choose between screen and eps output, to set the scale bar, to specify the horizontal
positions of the labels and the title of the plot and the fourth column if specified.
rochePlot pages
Similar packages
If you like rochePlot, you may also be interested in the following FOSS packages:
| astroTools | | command-line tools for astronomy and astrophysics |
| evTools | | tools to manipulate and display output from the binary stellar-evolution code ev/STARS/TWIN |
| GWtool | | tools for working with gravitational waves |
| libTheSky | | a Fortran library to compute the positions of celestial bodies and events with great accuracy |
GNU/Linux distributions
RochePlot is available in the following Linux distributions:
Contact
For questions or comments you can contact Frank Verbunt or
Marc van der Sluys.
|

 rochePlot home page

 RochePlot is a Fortran code using
  In order to run rochePlot, you must provide the data of the binary stars you want to plot in an input file.
The program expects the name of the input file as a command-line argument. If no argument is given, the code tries to find the example
input file